Active Markets
Most active contests by 24h dollar volume — click a row to see where bets are placed
| # | Contest | Category | 24h Volume | Total Volume | Liquidity | Open Interest | |
|---|---|---|---|---|---|---|---|
1 |  Fed Decision in October?5 markets | $2.89M | $49.92M | $4.54M | $7.34M | ||
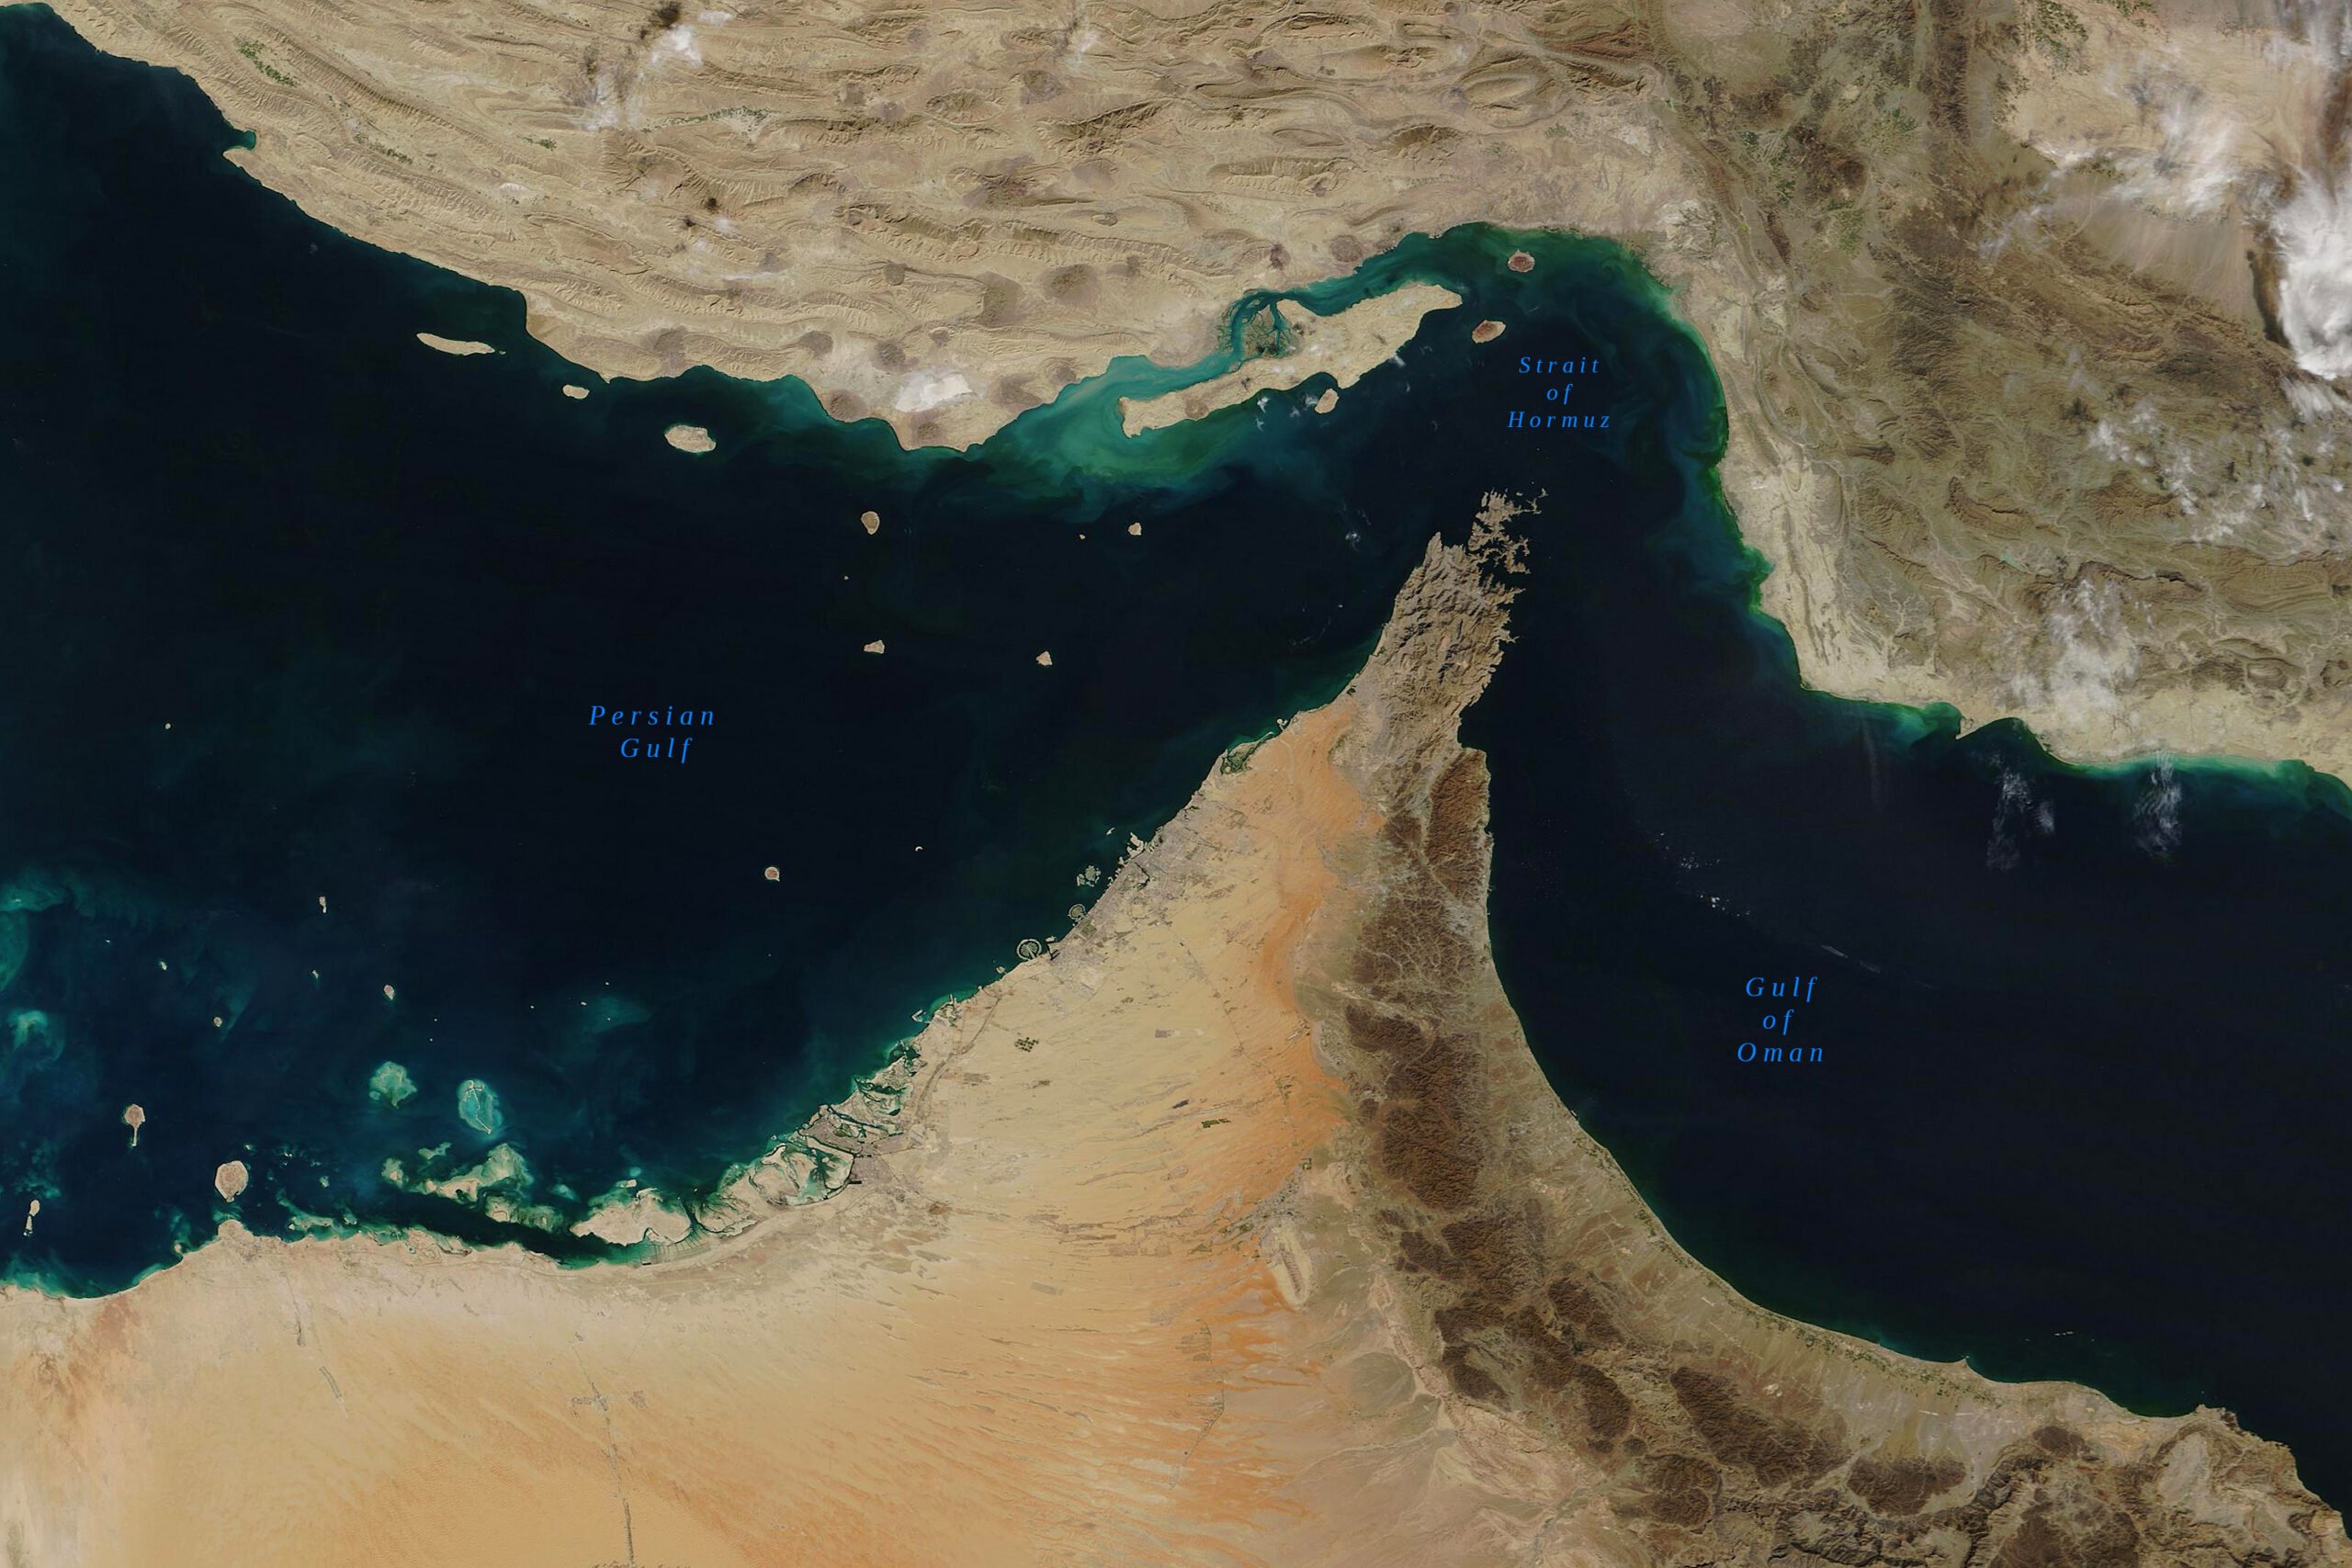
2 |  US-Iran ceasefire continues through...?20 markets | $1.73M | $18.76M | $653.8K | $1.42M | ||
3 |  Ballon d'Or Winner 202689 markets | $1.36M | $54.59M | $11.42M | $4.24M | ||
4 |  UEFA Champions League: 2027 Champion42 markets | $975.4K | $55.85M | $11.77M | $1.18M | ||
5 |  Brazil Presidential Election32 markets | $974.0K | $188.76M | $1.05M | $10.87M | ||
6 |  Next French Presidential Election128 markets | $712.8K | $154.07M | $19.15M | $3.44M | ||
7 |  Democratic Presidential Nominee 2028128 markets | $597.7K | $1295.70M | $75.23M | $8.47M | ||
8 | $532.7K | $49.12M | $3.42M | $4.39M | |||
9 | $502.7K | $1.96M | $140.1K | $213.9K | |||
10 | $427.3K | $2.28M | $118.2K | $378.0K | |||
11 | $420.9K | $392.3K | $964.7K | $238.3K | |||
12 |  Cali: Nicolas Jarry vs Tomas Barrios17 markets | $409.2K | $409.6K | $159.7K | $180.5K | ||
13 | $407.6K | $408.9K | $19.9K | $147.6K | |||
14 |  Balance of Power: 2026 Midterms5 markets | $394.3K | $25.39M | $11.26M | $10.11M | ||
15 | $380.2K | $3.06M | $637.1K | $539.7K | |||
16 |  Bitcoin above ___ on October 20?11 markets | $340.2K | $496.9K | $473.7K | $317.6K | ||
17 |  Republican Presidential Nominee 2028128 markets | $322.4K | $713.78M | $50.87M | $8.89M | ||
18 | $312.1K | $41.55M | $381.8K | $1.90M | |||
19 | What price will Bitcoin hit in October?35 markets | $311.6K | $8.89M | $1.55M | $3.13M | ||
20 | What price will Bitcoin hit in 2026?47 markets | $311.1K | $76.59M | $3.86M | $14.07M | ||
21 | $292.6K | $37.19M | $247.6K | $1.34M | |||
22 | $282.9K | $737.0K | $182.7K | $169.4K | |||
23 | $265.4K | $18.68M | $6.53M | $8.93M | |||
24 | $240.4K | $292.2K | $1.57M | $284.1K | |||
25 | $237.6K | $29.68M | $783.4K | $7.56M | |||
26 | $232.2K | $1.33M | $140.8K | $332.3K | |||
27 | $230.7K | $2.07M | $869.0K | $1.19M | |||
28 |  Presidential Election Winner 2028128 markets | $206.6K | $717.44M | $60.09M | $40.30M | ||
29 |  Israel Election: Likud # of seats?5 markets | $204.7K | $806.0K | $276.3K | $430.4K | ||
30 | $203.3K | $621.3K | $48.8K | $99.8K | |||
31 |  Manchester City FC vs. AEK3 markets | $201.0K | $315.7K | $557.3K | $274.4K | ||
32 | $196.2K | $168.0K | $717.4K | $103.5K | |||
33 |  Pro Football: 2027 Champion33 markets | $195.7K | $68.55M | $6.65M | $1.06M | ||
34 |  Worlds 2026: Winner20 markets | $192.8K | $1.87M | $2.23M | $244.0K | ||
35 | $189.2K | $3.15M | $357.7K | $1.17M | |||
36 |  MLB World Series Champion 202631 markets | $186.4K | $45.47M | $529.3K | $1.06M | ||
37 |  Ethereum above ___ on October 20?11 markets | $182.8K | $259.1K | $194.3K | $173.1K | ||
38 | $179.0K | $381.7K | $86.9K | $112.5K | |||
39 | $169.8K | $805.9K | $228.9K | $107.4K | |||
40 |  Texas Senate Election Winner13 markets | $167.2K | $4.24M | $783.2K | $2.48M | ||
41 | Fed Decision in December?5 markets | $166.9K | $4.11M | $937.2K | $569.3K | ||
42 |  AD Pasto vs. Alianza FC - More Markets46 markets | $164.2K | $164.2K | $1.24M | $71.1K | ||
43 | $154.6K | $15.22M | $573.1K | $1.59M | |||
44 |  Israeli Legislative Election Winner39 markets | $152.9K | $1.19M | $774.5K | $470.4K | ||
45 | SSC Napoli vs. FK Bodø/Glimt3 markets | $151.5K | $97.2K | $464.5K | $147.9K | ||
46 | $151.3K | $503.1K | $98.4K | $135.5K | |||
47 |  EPL: 2027 Champion24 markets | $150.9K | $22.78M | $10.32M | $2.18M | ||
48 |  LALIGA: 2027 Champion24 markets | $150.5K | $8.94M | $5.68M | $344.8K | ||
49 |  NBA: 2027 Champion36 markets | $149.2K | $26.58M | $8.48M | $741.0K | ||
50 | $148.5K | $158.0K | $267.5K | $153.7K |













How Polymarket market activity is measured
Every event listed above is a real-money prediction market on Polymarket, settled in USDC on Polygon. The ranking is driven by 24-hour dollar volume — the total value of shares that changed hands in the last day — because volume is the cleanest short-term signal of where attention and capital are actually going. A market can have thousands of watchers and almost no volume; those markets have wide spreads and prices that mean very little. When volume is high, the quoted probability reflects money at risk rather than opinion.
Total volume vs. 24-hour volume
Total volume is the cumulative amount traded since the market opened. It tells you how mature and well-explored a market is: a year-old election market with $40M of lifetime volume has been priced by a very large number of participants, so its odds are hard to beat without genuinely new information. A market with high 24-hour volume but low total volume is usually fresh news — a headline, a resolution date approaching, or a surprise — and that is generally where mispricing lives longest. Comparing the two numbers side by side is the fastest way to separate "long-running and efficient" from "just started moving."
Liquidity and why spreads matter
Liquidity here is the depth resting in the order book — the dollar value of live buy and sell orders around the current price. Deep books let you enter and exit near the quoted price; thin books mean your own order moves the market against you. A trader with an edge of three cents per share can lose all of it to slippage in a market with only a few thousand dollars of depth. As a practical rule, keep your position size well below the visible depth on the side you intend to exit, and treat the mid-price of an illiquid market as an estimate rather than a quote.
Open interest
Open interest is the value of positions currently held and not yet settled. Unlike volume, which resets each day, open interest measures standing exposure. Rising open interest alongside a moving price means new money is taking a side — a trend with conviction behind it. Rising volume with flat open interest usually means positions are being passed between traders rather than accumulated, which often precedes a stall. When open interest collapses ahead of resolution, participants are closing out early rather than waiting for settlement, which can itself be a signal about how confident the market has become.
Reading outcome prices as probabilities
Each outcome trades between $0.00 and $1.00 and settles at $1.00 if it occurs. A price of $0.62 therefore implies roughly a 62% chance, minus a small amount for fees and the cost of tying up capital until resolution. In multi-outcome events the prices across all outcomes should sum close to $1.00; when they sum meaningfully above or below, an arbitrage exists — see our Polymarket arbitrage guide for how to size those trades. To convert between decimal, American, and implied probability formats, use the odds converter, and size positions with the Kelly criterion calculator.
How QuantFox sources this data
Market data comes from Polymarket's public Gamma and CLOB APIs and is snapshotted regularly, so the table reflects the most recent capture rather than a tick-by-tick feed; press Refresh for a live pull. Click any event to open its detail page with per-outcome pricing and the largest positions, or head to the top traders leaderboard to see which wallets are on the other side of these markets.